Methods
The map applies 49 CFR 192.5 to a 36-inch intrastate gas transmission line in Denton and Collin counties, from the Texas RRC public pipeline dataset. The reported reach runs 70.64 miles from the Tarrant/Denton county line to the last Collin/Grayson crossing and includes 6.69 miles along the Grayson County side of the Collin/Grayson county line. This page explains how every number on the map is computed, which data it rests on, and where those data fall short.
1. What the site shows
Mileposts count from the Tarrant/Denton county line (milepost 0) east to the last Collin/Grayson crossing (milepost 70.64). The analysis line runs one mile past each end, so every mile that touches the reach is counted in full. The analysis year is 2026.
For every point of the reach the map shows:
- the class location in each year from 2006 to 2026, from building footprints and the year each building was built,
- every class increase, with the year a 192.609 study would have been required and the 192.611(d) deadline,
- the segments that became Class 3 and are candidates for the 192.611(a)(4) alternative added in 2026,
- stretches close to the next class,
- the buildings expected on platted lots over the next one to five years, and the class each stretch would reach,
- where the result depends on the centerline position or on how garages are counted.
Every number on the map and on this page comes from one run of the analysis. Its date and the engine version are in the footer.
| Result for 2026 | Value |
|---|---|
| Class 1 | 37.86 mi |
| Class 2 | 18.04 mi |
| Class 3 | 14.75 mi |
| Class 4 | none |
| Counted buildings in the 220-yard corridor of the reach | 1,408 |
| Dwelling units in those buildings | 1,418 |
| Class increases from 2006 to 2026 | 54 |
| 192.611(a)(4) candidate segments | 26 (11.05 mi) |
| Near-threshold stretches | 36 |
| Buildings for the 100-yard rule within 300 ft, pending confirmation | 3 |
2. The rule
The regulatory text is the eCFR edition current on November 4, 2026. It includes the class location change rule of January 2026 (Amendment 192-155, effective March 16, 2026, corrected May 29, 2026), which added 192.611(a)(4) and left 192.5 and 192.609 unchanged.
Class location unit and the sliding mile
"A class location unit is an onshore area that extends 220 yards (200 meters) on either side of the centerline of any continuous 1-mile (1.6 kilometers) length of pipeline." 192.5(a)(1)
Any continuous mile means a mile that slides along the line. The site finds every distinct position of the sliding mile from the start and the end of each building's span along the line, so no position is missed and no fixed grid is used. The class at a point is the highest class of any mile that contains it. A building counts in a mile when any part of its footprint lies inside that mile's 220-yard corridor, as PHMSA interpretation PI-95-0100 reads the rule.
Thresholds
Each mile is classed by its number of buildings intended for human occupancy. Each separate dwelling unit in a multiple dwelling unit building counts as a separate building (192.5(a)(2)).
| Class | Buildings intended for human occupancy in the mile |
|---|---|
| Class 1 | 10 or fewer |
| Class 2 | more than 10 and fewer than 46 |
| Class 3 | 46 or more, or the 100-yard rule below |
| Class 4 | buildings with four or more stories above ground are prevalent |
Cluster boundaries (192.5(c))
"When a cluster of buildings intended for human occupancy requires a Class 2 or 3 location, the class location ends 220 yards (200 meters) from the nearest building in the cluster." 192.5(c)(2)
The site uses the perpendicular method. The outermost building of the cluster is projected onto the centerline and the class runs 660 ft beyond it. PHMSA also accepts the arc method, which strikes a 660-ft arc from the building and gives a shorter extension for buildings set back from the line. The arc result is in the sensitivity table. All counted buildings in a Class 2 or 3 mile form one cluster, and extents of one class that meet or overlap merge. A stretch can therefore lie inside a busy mile and still be Class 1, when it is more than 220 yards beyond the outermost building of the cluster.
The 100-yard rule (192.5(b)(3)(ii))
A Class 3 location is also an area where the pipeline lies within 100 yards (300 ft) of a building or a small, well-defined outside area occupied by 20 or more persons on at least 5 days a week for 10 weeks in any 12-month period. Public data cannot show how many people use a building. Schools, churches, day cares and similar buildings found in the footprint and appraisal records are carried as candidates. Where the line lies within 300 ft of one, the stretch is marked Class 3, pending confirmation. On this reach that is a school near milepost 8.3 and two church buildings near milepost 40.8. The church stretch is Class 3 by count as well.
Class 4
A building with four or more stories, or 40 ft or taller, is a four-story building. Such buildings are prevalent in a mile when there are at least two of them and they make up at least half of the counted buildings. The Class 4 location ends 220 yards beyond the nearest four-story building (192.5(c)(1)). No counted building near this line qualifies, so the reach has no Class 4.
192.609 study and 192.611(d) deadline
192.609 requires a study whenever an increase in population density indicates a change in class location for a segment of an existing steel pipeline operating at a hoop stress above 40 percent of SMYS. 192.611(d) requires the maximum allowable operating pressure (MAOP) to be confirmed or revised within 24 months of the change. For each class increase in year Y the site shows a study year Y and a deadline Y + 2. The operating pressure and the pipe of a public line are unknown, so both dates are hypothetical: they hold only if the segment operates above 40 percent of SMYS.
The 2026 lens: 192.611(a)(4)
192.611(a)(4) lets an operator confirm the MAOP of an eligible Class 3 segment through integrity management requirements, instead of reducing pressure, retesting or replacing pipe. The initial requirements are due by March 16, 2028, or 24 months after the class location change, whichever is later. They include a baseline assessment of the inspection area, a pressure test to at least 1.25 times MAOP, verified pipe records, rupture-mitigation valves on both sides, and a class location study of the inspection area at least once each calendar year.
A segment is eligible only if an instrumented in-line inspection tool can assess it and it contains no bare pipe, no wrinkle bends, no lap-welded seam, no seam with a joint factor below 1.0, and no history of cracking leaks or ruptures on it or on similar segments within 5 miles (192.3). The map marks every 2026 Class 3 segment that reached Class 3 from Class 1 or 2 during the record: 26 segments, 11.05 miles. Pipe condition decides eligibility, and public data cannot show it.
3. Data sources and attribution
All inputs are public and were retrieved on November 7, 2026.
| Data | Source | Vintage | Terms |
|---|---|---|---|
| Pipeline centerline | Railroad Commission of Texas, Texas Pipeline Mapping System, public layer | features modified 2026-08-24 | Public information. The RRC states that these data are not an authoritative record. Positional accuracy reported by the operator: 51 to 300 ft. |
| County lines | US Census Bureau, cartographic boundary file | 2024 | Public domain |
| Building footprints | USA Structures, Oak Ridge National Laboratory and FEMA | imagery 2009 to 2023 | US government work |
| Additional footprints | Overture Maps Foundation, buildings theme | release 2026-10-21.0 | ODbL 1.0 for OpenStreetMap and Microsoft ML Buildings data, CC BY 4.0 for Esri Community Maps data |
| Parcels and year built | Denton, Collin and Grayson Central Appraisal Districts, Tarrant Appraisal District data through the City of Fort Worth parcel view | appraisal years 2026 and 2027 | Public appraisal records, kept for taxation, not a survey |
| Address points, plats, parcel snapshots | Denton Central Appraisal District | snapshots 2015, 2020, 2023, 2025 | Public appraisal records |
| Plats | Collin and Grayson Central Appraisal Districts | 2026 | Public appraisal records |
| Permits | Denton County development permits, City of Denton yearly permit reports | county to June 2023, city 2022 to 2026 | Public records |
| City labels | US Census Bureau, 2024 Gazetteer of places | 2024 | Public domain |
No owner names are published. The appraisal layers on the map and in the downloads leave out owner fields, situs addresses and legal descriptions.
Attribution
- Pipeline centerline: Railroad Commission of Texas, Texas Pipeline Mapping System, public data retrieved 2026-11-07. The RRC states that these data are not an authoritative record. Positional accuracy reported by the operator: 51 to 300 ft.
- County boundaries: US Census Bureau, 2024 cartographic boundary files.
- Building footprints: USA Structures, Oak Ridge National Laboratory and FEMA.
- Additional building footprints: Overture Maps Foundation (release 2026-10-21.0), overturemaps.org, including data from (c) OpenStreetMap contributors, available under the Open Database License, Microsoft ML Buildings (ODbL) and Esri Community Maps contributors (CC BY 4.0).
- Parcels and year built: Denton Central Appraisal District, Collin Central Appraisal District, Grayson Central Appraisal District, and Tarrant Appraisal District data through the City of Fort Worth parcel view.
- Permits: Denton County and City of Denton public permit records.
- Satellite basemap: USGS The National Map orthoimagery tile service (USGS Imagery Only), public domain. The imagery comes mainly from the USDA National Agriculture Imagery Program and was refreshed in June 2024. Tiles end at zoom 16 and are enlarged beyond it.
- Streets basemap and map label fonts: OpenFreeMap, with tiles in the OpenMapTiles schema. Map data (c) OpenStreetMap contributors, under the Open Database License.
- Map library: MapLibre GL JS 5.24.0, BSD 3-Clause license (license text).
License notice for the structure layers
The structure layers (structures, secondary_buildings, assembly_candidates, centerline_conflicts and the structures inside the GeoPackage, shapefile and records) contain building footprints derived from Overture Maps data that include OpenStreetMap and Microsoft ML Buildings data under the Open Database License 1.0 (https://opendatacommons.org/licenses/odbl/1-0/). As derivative databases, these layers are made available under the ODbL 1.0. (c) OpenStreetMap contributors.
4. Counting conventions
Public data do not say which buildings are intended for human occupancy. These are the rules the site applies. Each is meant to avoid both undercounting and false class increases.
- What counts. Homes, apartments, businesses, schools, churches and government buildings count. Barns, sheds, detached garages, utility structures and small unclassified buildings on farm parcels do not. A footprint without a class counts on a residential or commercial parcel when it covers at least 450 square feet.
- Farm residences. On a residential parcel whose buildings are all classed as agricultural, the largest one is taken as the home and counted.
- Secondary buildings. A single-family lot counts its largest building plus one more for each extra address point on the lot, since an extra address points to a second dwelling. Its other buildings are drawn in gray and not counted. 255 buildings in the corridor of the reach are set aside this way. Counting them anyway moves the 2026 class on 2.95 miles.
- Dwelling units. Each building counts as one dwelling unit, except on multifamily parcels. There the units come from address points with unit numbers, from the appraisal unit count, or from the living area divided by 900 square feet.
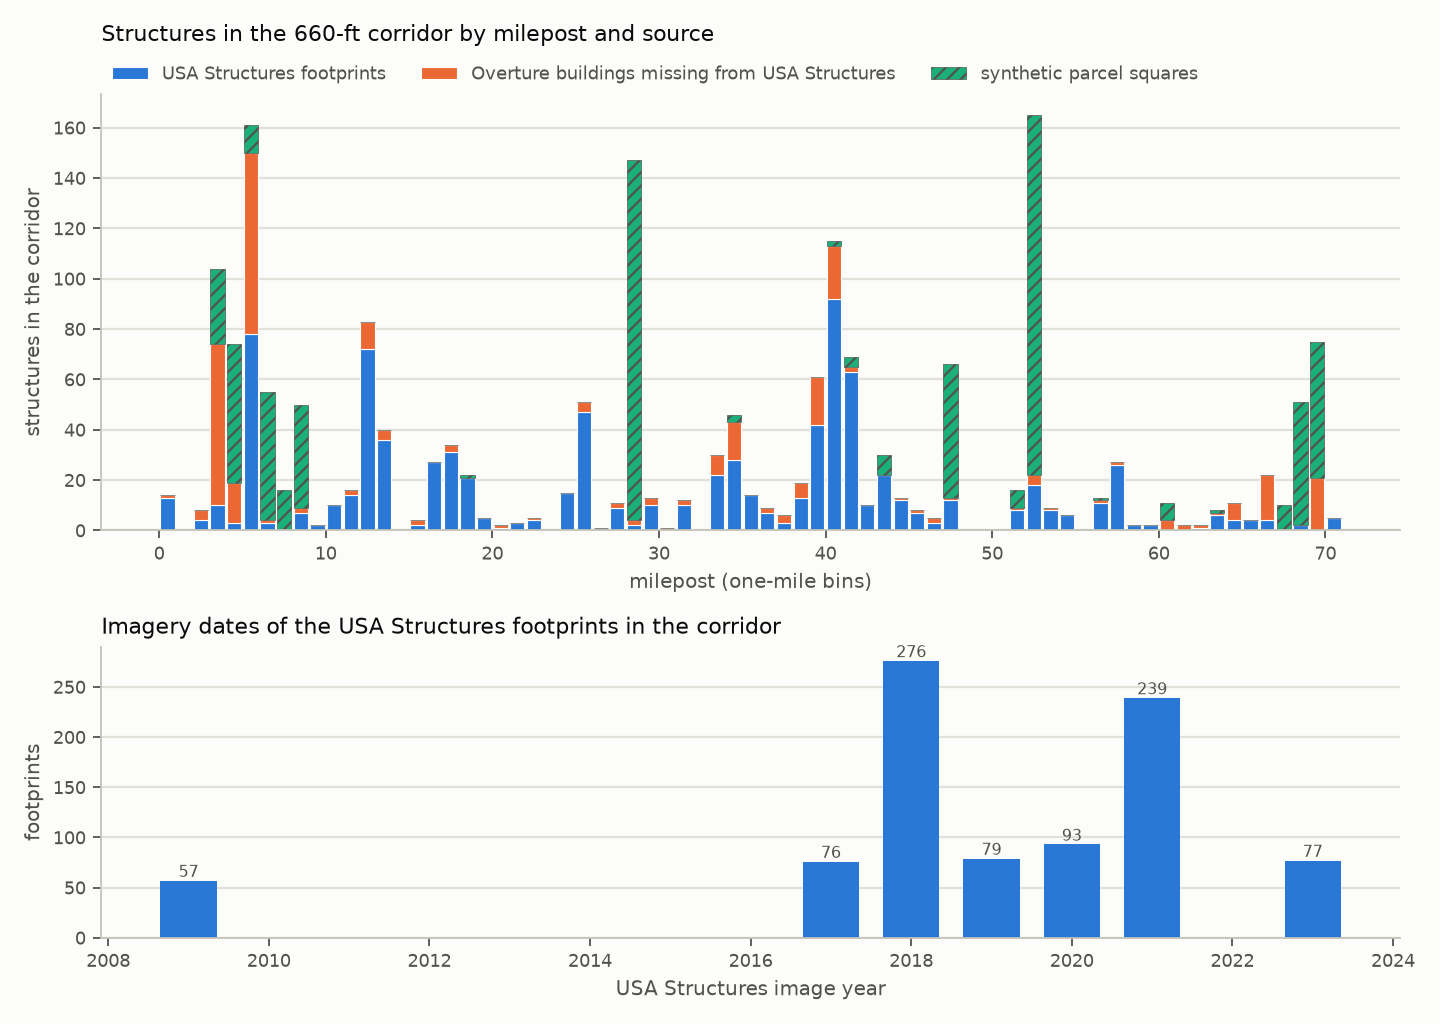
- Missing footprints. Footprint data lag construction by two to five years. An improved parcel without a footprint gets a 40 by 40 ft square at its address point, drawn on the map with a dashed outline. 690 such squares lie in the corridor of the reach, most of them houses built since 2024.
- County lines. A lot carried by two appraisal districts along a county line is kept once.
- Centerline conflicts. A footprint within 25 ft of the centerline cannot stand over a 36-inch line in an easement, so it marks a place where the public centerline is off. The building keeps its counting status and the segments it affects are flagged.
- Candidates for the 100-yard rule. These come from footprint attributes and from the appraisal records of exempt and commercial parcels whose owner or business name indicates a school, church, day care or similar use. Names are matched during processing and never published.
5. Year built and the class history
Each building exists from the year its parcel's main improvement was built, as the appraisal district records it. The class profile is computed for every year from 2006 to 2026 with the buildings that stood in that year.
96.2 percent of the counted buildings in the corridor of the reach have an actual year built. The other 54 get an estimated year, taken in this order: the parcel's effective year built, the plat year plus one, the first Denton parcel snapshot that shows the parcel, the imagery date of the footprint. An estimate is never later than the imagery date, because the footprint proves the building stood then. Estimated years are flagged on the building and on the segments they affect.
From 2006 to 2026 the class rose 54 times. 34 of the increases came from 2020 on, and 12 in 2025 alone. No decrease appears, because demolished buildings are not in the data.
Limits of the reconstruction:
- A building torn down before 2026 is missing from every year, so past classes can be understated.
- The year of an old farmhouse can carry over to a new lot carved from the farm, which places that one building early.
- Secondary buildings take the year of the parcel's main building.
- The Denton parcel snapshots test the timing of the subdivisions along the corridor: 13 of 70 fail the test, and each failure has an explanation in the data (see Validation).
6. Prediction
The prediction layer estimates how many buildings will be added over the next 1, 2, 3 and 5 years and what they do to the class. It uses the platted lots that are still vacant and a build-out curve measured on the subdivisions around this corridor.
Build-out curve
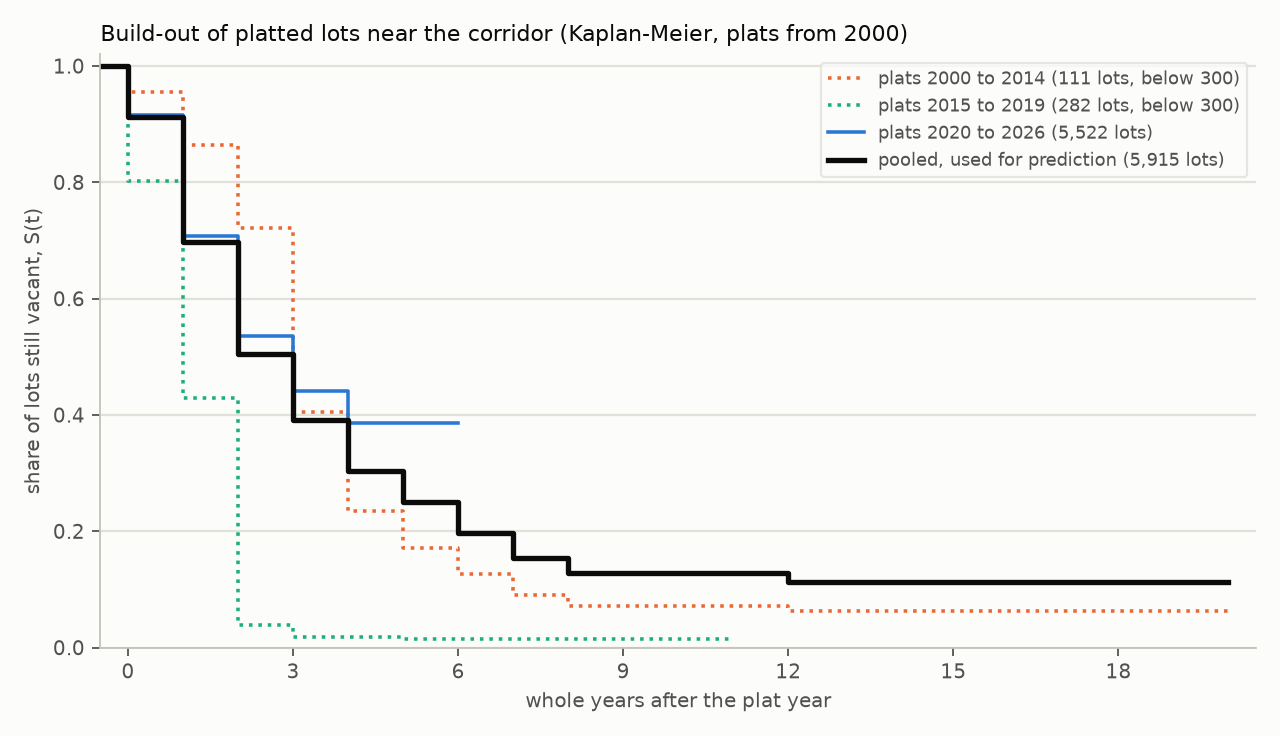
The curve comes from 5,915 residential lots in 53 plats recorded since 2000 near the corridor. For each lot the time from the plat year to the year built is measured, and lots still vacant count as vacant so far (a Kaplan-Meier estimate). 30 percent of lots are built within one year, 50 percent within two, 61 percent within three and 75 percent within five. The median is 3 years. The plats of 2000 to 2014 and of 2015 to 2019 hold too few lots for curves of their own, so one pooled curve serves every lot.
Lots and probabilities
1,605 vacant platted lots touch the 220-yard corridor. 127 are left out: 94 are not residential building lots (common areas, farm tracts, commercial lots) and 33 already hold a counted building. Each of the other 1,478 lots gets the probability of a building within h years given how long it has stood vacant: one minus the share of lots still vacant at its age plus h, divided by the share still vacant at its age. 389 lots carry a stand-in plat year and are flagged.
Summed over the lots, 364 new buildings are expected within one year, 616 within two, 793 within three and 1,033 within five. The corridor of the reach holds 1,408 counted buildings in 2026.
Predicted classes and the probability of an increase
Each lot becomes one expected building, a 40 by 40 ft square with one dwelling unit. The expected count of a mile is the sum of the probabilities, and the predicted class at the expected count follows with the same rules, cluster boundaries included. The 90th percentile count comes from 500 random draws of the lots, so one outcome in ten is higher.
The probability of a class increase comes from 300 joint draws. In each draw every lot is built or not with its own probability, the class profile is recomputed, and the share of draws in which a point rises above its 2026 class is kept. The probability is above 0.5 on 4.31 miles within one year, 7.26 within two, 7.28 within three and 7.90 within five.
Near-threshold stretches
A near-threshold stretch is covered by miles with 8 to 10 dwelling units (up to 3 short of Class 2) or 40 to 45 (up to 6 short of Class 3) where the class is still below the target. There are 36. For each the map gives the expected new buildings in its miles and the probability that part of it reaches the target class. 10 of the 36 have a probability above 0.5 at every horizon. A stretch that lies more than 220 yards beyond the clusters that grow keeps a probability of zero however many lots its miles hold, because the cluster boundary rule stops the class before it.
Permits
Issued residential permits would form a near-certain tier, expected within a year. The public permit data along this corridor are thin: the Denton County layer ends in June 2023 and the cities publish little. No permit of 2024 or later lies on a vacant lot near the line, so this tier is empty and the prediction rests on the plats.
What the prediction leaves out
- Lots are treated as independent. Builders work a subdivision in phases, so real outcomes move together and the spread is wider than the draws show. The expected counts are not affected.
- Land that is zoned or annexed but not yet platted has no lots and no probability.
- The curve comes from a period of fast growth around Denton, Celina and Anna. A slowdown would make it optimistic.
- Each lot holds one house. Lots that will hold duplexes, townhomes or rental communities are undercounted.
7. Sensitivity
The RRC centerline carries an operator-reported accuracy of 51 to 300 ft. The analysis was rerun with the line shifted 75 and 150 ft to each side, with the arc boundary method, with secondary buildings counted, with two other rules for buildings without a year, and without each of the two added footprint sources. North and south are the left and right of the direction of the mileposts. No variant produces Class 4.
| Variant | Class 1 mi | Class 2 mi | Class 3 mi | Increases 2006 to 2026 | 2026 class differs, mi | Counted buildings |
|---|---|---|---|---|---|---|
| As mapped (perpendicular boundaries) | 37.86 | 18.04 | 14.75 | 54 | 0 | 1,408 |
| Centerline 150 ft south | 37.72 | 18.55 | 14.38 | 57 | 5.25 | 1,477 |
| Centerline 75 ft south | 37.07 | 19.07 | 14.50 | 59 | 4.37 | 1,437 |
| Centerline 75 ft north | 37.15 | 18.98 | 14.52 | 51 | 1.77 | 1,414 |
| Centerline 150 ft north | 39.09 | 20.31 | 11.24 | 42 | 6.98 | 1,329 |
| Arc boundary method | 38.68 | 17.63 | 14.33 | 54 | 0.97 | 1,408 |
| Secondary buildings counted | 36.40 | 17.80 | 16.44 | 52 | 2.95 | 1,663 |
| No estimated years, buildings without a year in every year | 37.86 | 18.04 | 14.75 | 47 | 0 | 1,408 |
| No estimated years, buildings without a year in 2026 only | 37.86 | 18.04 | 14.75 | 52 | 0 | 1,408 |
| Without the Overture buildings | 40.47 | 17.20 | 12.97 | 41 | 3.89 | 1,173 |
| Without the parcel squares | 48.00 | 15.55 | 7.10 | 35 | 12.34 | 718 |
- Centerline position. A shift of 150 ft moves the 2026 class on 5.25 to 6.98 miles, a shift of 75 ft on 1.77 to 4.37 miles. 11.63 miles change class under at least one of the four shifts. The longest are milepost 11.8 to 13.5, 59.6 to 60.9 and 43.0 to 44.3. The history is more sensitive still (8.7 to 16.3 miles), because older, smaller clusters sit close to the thresholds.
- Secondary buildings. Counting the garages and sheds of single-family lots adds 255 counted buildings and raises the 2026 class on 2.95 miles.
- Boundary method. The arc method shortens Class 2 and 3 by 0.83 miles in all. 0.97 miles differ, and the history keeps its 54 increases.
- Buildings without a year. Every rule has the same buildings in 2026, so the 2026 classes agree. The history moves by 5.2 to 6.2 miles.
- Footprint sources. These two rows remove buildings without replacing them, so they bound how much of the result rests on each source. The parcel squares carry most of the growth since 2020.
On the map, the Centerline sensitivity layer marks the stretches whose 2026 class changes under a shift and those whose class changes when garages and sheds are counted. An operator centerline would remove the first flag.
8. Validation
Subdivision timing against the parcel snapshots
Denton CAD publishes parcel snapshots of 2015, 2020, 2023 and 2025. If the year built of a subdivision's lots is right, its lots must exist in the first snapshot taken in or after its earliest year built. The check covers the 70 platted Denton subdivisions with a lot in the corridor and at least one built lot. 13 fail, and each failure has an explanation in the data.
| Subdivision | Plat year | Earliest year built | Lots first seen | Explanation |
|---|---|---|---|---|
| BLACKJACK ADDN | 2021 | 1984 | 2025 | older parcel year, lot split |
| J & J ACRES | 2023 | 1978 | 2023 | older parcel year, lot split |
| KD BARNES ADDITION | 2023 | 2018 | 2025 | older parcel year, lot split |
| LYNCH FARMS | 2022 | 1986 | 2023 | older parcel year |
| M & R WRIGHT ADDITION | 2025 | 1945 | 2020 | older parcel year, lot split |
| MOBBERLY MULTI-FAMILY ADDITION | 2023 | 1985 | 2023 | older parcel year, lot split |
| TABOR RANCH PHASE 1 | 2025 | 2012 | not yet | older parcel year, lot split |
| GREEN VALLEY ADDITION | none | 2015 | 2020 | lot split |
| O'DELL ADDITION | none | 1981 | 2020 | lot split |
| WEST ADDITION | none | 2000 | 2023 | lot split |
| SARATOGA PHASE 1 | 2025 | 2025 | not yet | platted after the 2025 snapshot |
| TRADITION PHASE 8A | 2025 | 2025 | not yet | platted after the 2025 snapshot |
| TRADITION PHASE 9A | 2025 | 2025 | not yet | platted after the 2025 snapshot |
"Older parcel year" means the earliest year predates the plat, or the subdivision's median year by more than ten years: a house kept on its lot when the land around it was platted, or a year carried over from the parent tract. "Lot split" means the lot is a new property while most of its land belonged to another property in an earlier snapshot. No failure points to a whole subdivision with wrong years.
Footprint currency
The corridor of the reach holds 897 USA Structures footprints, 341 Overture buildings that USA Structures lacks, and 690 parcel squares. The USA Structures imagery dates from 2009 to 2023, median 2019, so the footprint sources end around 2023. Of the 881 counted buildings built from 2020 to 2026, 689 (78 percent) are parcel squares, 178 Overture buildings and 14 USA Structures footprints. The class increases of 2024 to 2026 rest almost entirely on squares.
Centerline conflicts
Six footprints in the reach lie within 25 ft of the public centerline: a barn at milepost 12.7, a farmstead at milepost 25.1 (two barns and the house, which is counted and sets the class of six segments), a garage at milepost 39.5 and a barn at milepost 54.1. Two counted commercial buildings 13 and 14 ft from the line stand just past the east end of the reach. None of them can stand over a 36-inch line in an easement, so the public line is off at those places, which fits its stated accuracy.
Spot check against imagery
A seeded sample of 15 counted footprints and 10 parcel squares has been drawn for a check against imagery: does a building stand at each point, is it a dwelling or business, and does the year fit the imagery date. That check is pending.
9. Limitations
- Centerline accuracy. The public centerline is accurate to 51 to 300 ft by the operator's own report, and footprints on the line show it is off in places. 11.63 miles change class under a shift of 75 or 150 ft.
- Footprint currency. The footprint sources end around 2023. Newer houses are parcel squares at the address point, which can sit up to half a lot depth from the house and fall on either side of the corridor edge.
- Secondary buildings. Public data cannot tell a detached garage from a guest house. The site counts one building per single-family lot plus one for each extra address point.
- Occupancy. Barns, shops and sheds are excluded by their class, so a converted barn would be missed. The 20-person test of the 100-yard rule cannot be checked.
- Demolitions. Buildings torn down before 2026 are invisible, so past classes can be understated.
- Year built. The year is the appraisal district's year for the main improvement. It can be wrong or carried over from a parent tract.
- Hoop stress. The 192.609 and 192.611 dates assume operation above 40 percent of SMYS. Pressure, pipe and test records of a public line are unknown.
- Prediction. Lots are treated as independent and only platted land is predicted.
- Clusters. All counted buildings of a Class 2 or 3 mile form one cluster. Separate clusters inside one mile are not split.
10. Downloads
All files describe the 2026 run shown on the map and open in QGIS. Stations are feet along the analysis line from its west end. Mileposts count from the Tarrant/Denton county line. The structure layers are under the ODbL 1.0 (see the license notice).
| File | Contents | Format | Size |
|---|---|---|---|
| classloc_2026.gpkg.zip | Every layer: class segments, class by year, corridor, buildings, secondary buildings, assembly candidates, centerline conflicts, near-threshold stretches, class changes, predicted lots and classes by horizon, sensitivity | GeoPackage in EPSG:2276 (NAD83 Texas North Central, US survey feet) | 1.7 MB |
| tables_csv.zip | The same tables | CSV | 0.2 MB |
| shapefiles.zip | Class segments and buildings | Shapefile in EPSG:2276, field names cut to 10 characters | 0.7 MB |
| segments_kml.zip | Class segments | KML in EPSG:4326 | 30 kB |
| records_192_5d.zip | One record per segment in the sense of 192.5(d): class, method, parameters, the governing mile and its count, the buildings that set the class with their sources, the change history, the data vintages and the run. The map links each segment to its own record. | JSON | 0.8 MB |
| README.txt | Description, disclaimer, attribution and license notice | Text | 3 kB |
11. What an engagement adds
This demonstration stops where public data stop. With an operator's data the same method runs on:
- the operator's surveyed centerline, which removes the largest uncertainty on this page,
- the operator's structure survey or patrol observations, to confirm occupancy, dwelling units and the 20-person test,
- pipe and test records, so the 192.609 and 192.611 flags follow from the actual hoop stress and 192.611(a)(4) eligibility can be screened,
- permit and plat feeds from the cities and counties along the line, so the prediction can use issued permits as well as plats,
- a refresh on a fixed cadence, with each run kept as a dated set of 192.5(d) records and a list of what changed since the last run. A segment confirmed under 192.611(a)(4) needs a class location study at least once each calendar year.